TVB Broadcast Members: PowerPoint with additional content available when logged in. To Request Login: Create a TVB member account | Request forgotten password
Download Overview PDF | Press Releases
There continues to be much discussion of streaming’s share of total viewing, however, there is still far less discussion about the share of total viewing that has advertising. Advertisers cannot reach many of these streaming viewers because some platforms, such as Apple TV+, are advertising-free. Other streaming platforms, such as Hulu, Max (formerly HBO Max), and now Netflix, Disney+, and Amazon Prime Video offer tiered subscriptions, and the viewer may or may not see ads depending on which tier they pay for.
In fact, on June 20 2024, TVB again issued a press release on the results of Nielsen’s Media Distributor Gauge report, as well as their monthly Gauge report:
The monthly Nielsen Gauge and new Media Distributor Gauge reports provide an analysis of the content and programming that audiences are watching on television, including broadcast, cable, and streaming platforms. However, these reports do not provide the key data needed by advertisers: Where do consumers see their commercials? “The Gauge reports combine all video platforms in one analysis – without separating ad-supported viewing from non-ad supported viewing – which misleads marketers into thinking their commercials can reach significantly more streaming viewers than is possible or the reality,” said Steve Lanzano, TVB CEO and President. “Advertisers’ commercials only reach consumers on ad-supported video platforms. When viewing of ad-supported platforms is analyzed alone, the results are very different from what is shown in the Gauge report because many streaming viewers do not receive ads. TVB is doubling down on our request for Nielsen to include an ad-supported-only analysis in all future Gauge Reports. Advertisers need these facts when considering video media investments.”
TVB continues to analyze linear and streaming viewing using Nielsen’s total use of television and streaming platform ratings, and the results showcase the value linear TV represents to advertisers.
The following key points highlight the strength of linear television to advertisers
- For March 2025, when looking at the Adults 18+ total viewing day (The Gauge report Nielsen continues to share is for people 2+), linear television represents 49% of viewing, compared to streaming TV’s 41%.
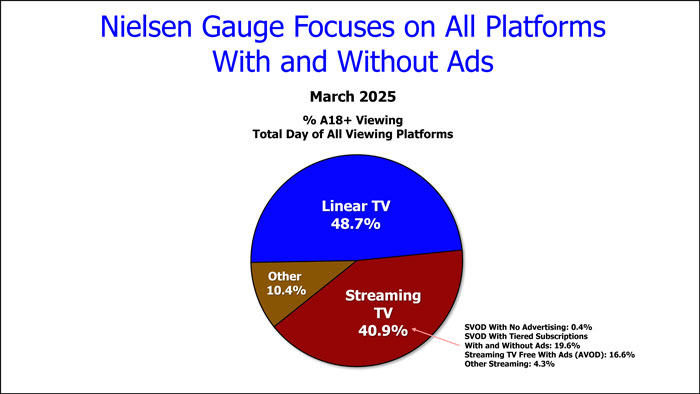
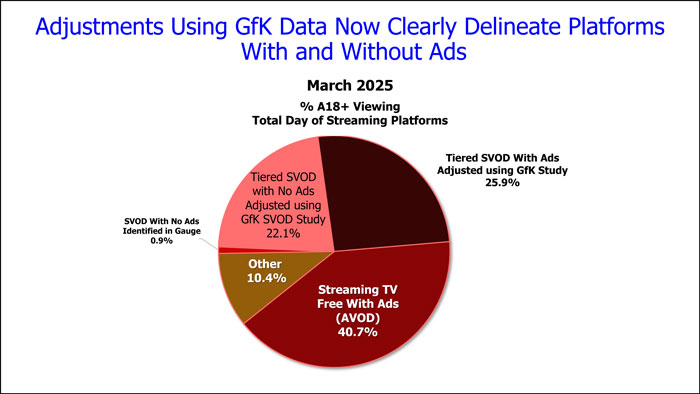
- Streaming viewing may be 41% of the total viewing day, but that does not translate to ad-supported viewing. Many SVOD platforms have different tiers, some with ads and some without; Nielsen shows one number for these platforms e.g., Hulu total viewing, versus Hulu with ads and Hulu without ads. As a result, advertisers do not know the number of subscribers viewing ads available to them.
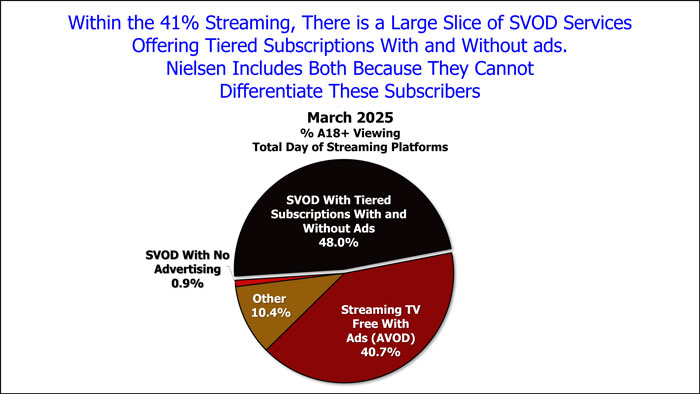
- Recognizing this, the TVB commissioned GfK to do an updated 2024 SVOD Study to examine and better understand the streaming networks that people pay to get like Netflix, Amazon Prime Video, Disney+, Max, Hulu, Paramount+, Peacock, etc.
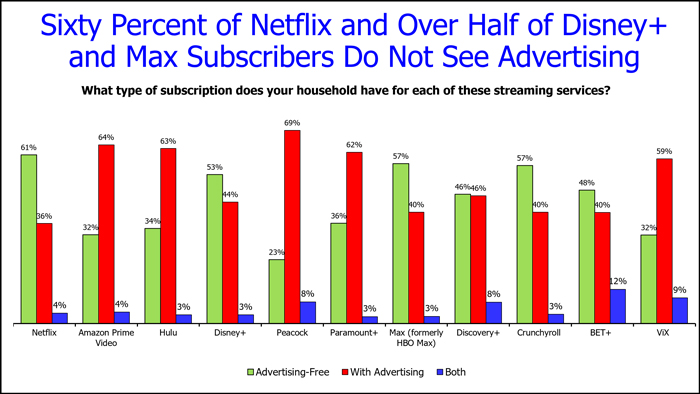
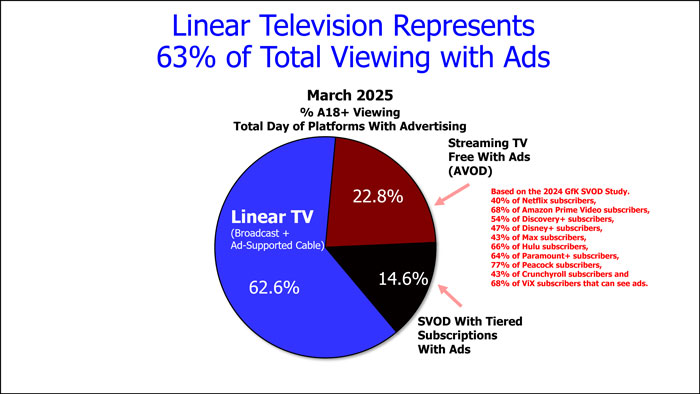
- The 2024 study showed that given a choice, many adult 18+ subscribers that are already paying for a subscription will pay more to get programming without ads on tiered SVOD platforms. Only 40% of Netflix subscribers (including multi-TV set households where 4% subscribe to both ad-supported and ad-free tiers), 68% of Amazon Prime Video subscribers (including 4% that have both), 66% of Hulu subscribers (including 3% that have both), 47% of Disney+ subscribers (including 3% that have both), 77% of Peacock subscribers (including 8% that have both), 43% of Max subscribers (including 3% that have both), 64% of Paramount+ subscribers (including 3% that have both), 54% of Discovery+ subscribers (including 8% that have both), 43% of Crunchyroll subscribers (including 3% that have both), and 68% of ViX subscribers (including 9% that have both), subscribe to an advertising tier.
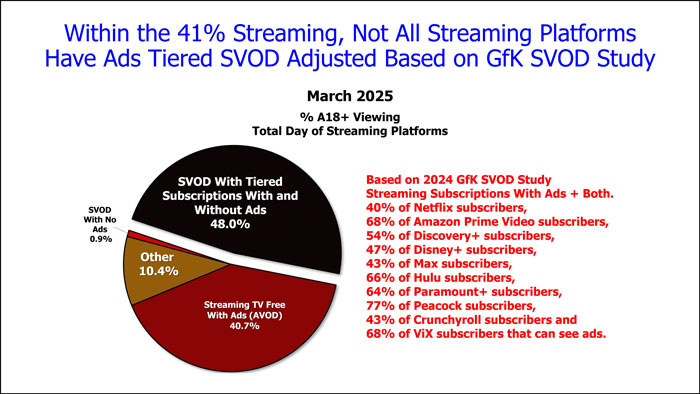
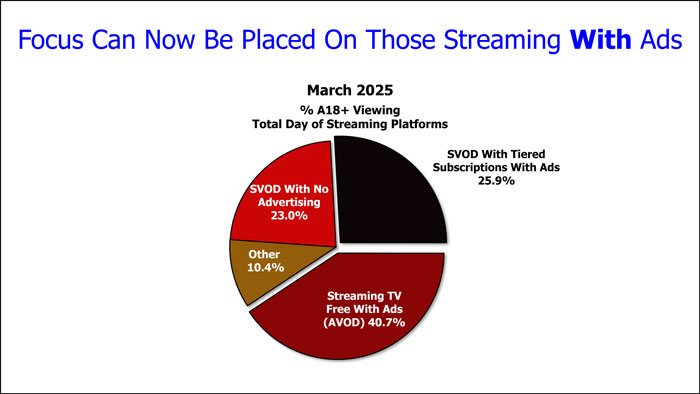
- In assembling a pie that dealt only with platforms that have advertising, we used those results from the 2024 GfK TVB SVOD Study to approximate ad viewing subscribers for those services. Using those percentages, we estimated those Netflix, Amazon Prime Video, Discovery+, Disney+, Max, Hulu, Paramount+, Peacock, Crunchyroll, and ViX subscribers that can see ads represent 27% of the total streaming pie, while 23% chose tiers with no advertising.
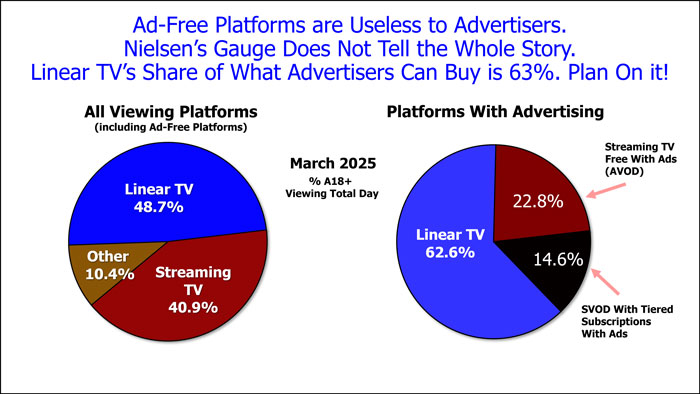
- Applying these assumptions, we developed a total viewing pie of platforms/tiers that have advertising, which included linear TV, AVOD and SVOD with tiered subscriptions. The result indicated linear TV represents 63% of total day of the ad-viewing platforms, a far cry from a pie including all viewing whether advertisers can avail themselves of it or not, showing linear TV at 49%.
- Ad-free platforms are useless to advertisers. They need to know the platforms/subscribers available to them who can view advertising, so they can make informed marketing choices. Nielsen’s Gauge Report doesn’t tell the whole story. Linear TV’s share of what advertisers can buy is 63%. Plan on it!
For more information, please contact Hadassa Gerber, Chief Research Officer, TVB.